Nabin K. Malakar, Ph.D.

NASA JPL
I am a computational physicist working on societal applications of machine-learning techniques.

Research Links

My research interests span multi-disciplinary fields involving Societal applications of Machine Learning, Decision-theoretic approach to automated Experimental Design, Bayesian statistical data analysis and signal processing.

Linkedin


Interested about the picture? Autonomous experimental design allows us to answer the question of where to take the measurements. More about it is here...

Hobbies

I addition to the research, I also like to hike, bike, read and play with water color.

Thanks for the visit. Please feel free to visit my Weblogs.

Welcome to nabinkm.com. Please visit again.

Friday, April 8, 2016

An Interview with Dr. Mike Abrams, #ASTER project leader @NASAJPL

The Advanced Spaceborne Thermal Emission and Reflection Radiometer (ASTER) instrument has been flying in space on the Terra platform since its launch in 1999. Not bad for a satellite which had an expected lifespan of five-years. Hopefully it will continue into the foreseeable future. The instrument acquires images in visible, near infrared, and thermal infrared wavelengths (TIR). The spatial resolution range from 15 to 90 meters. ASTER spans +- 83 degree latitudes, and covers 99 percent of earth's landmass.  ASTER also produces one of the high resolution elevation dataset (30m).
Recently, NASA released the complete archive (2.95 million images) of Earth's thermal infrared images to the public with unlimited access. Previously, users could access ASTER's global digital topographic maps for free, however, other ASTER data products were available at nominal fee paid to Japan’s Ministry of Economy, Trade and Industry (METI).
ASTER has been used to study, map, and monitor the ever-changing surface of our planet Earth. Some of the products and application of ASTER data include surface mapping and monitoring of changes in surface properties such as glacial advance/retreat, volcanism, crop stress, cloud properties, wetlands, coral reef degradation, land surface temperature, surface geology, etc.

A good selection of ASTER images can be found on the ASTER web site, gallery pages:

The dataset is available at:

We stopped by the office of Dr. Mike Abrams, the project leader for ASTER science team at NASA JPL.
Here are 5 quick questions with him:

1. Please share your experience with the ASTER project.
I have been involved with the ASTER project since its inception in 1988 as part of NASA’s Earth Observing System (EOS) program. Working with my Japanese colleagues and traveling to Japan has been an enriching inter-cultural experience. Added to that is the satisfaction of the success of our 16-year joint mission
2. Why are the millions of ASTER images being made public?
In Japan, oversight of the ASTER project was transferred from one organization to another. The new operator is part of Japan’s National Science Institutes. Jointly, with NASA, the decision was made to eliminate charging for all ASTER data.

3. How can users get maximum use out of the ASTER data?
Natural color, full resolution JPEG images can be downloaded for all images in the archive. No sophisticated software is needed to view these images. (https://lta.cr.usgs.gov/terralook/home). To do more in-depth analyses, the digital data must be downloaded, then analyzed with GIS or image processing software.

4. What are the unique feature of ASTER? (Some examples of news for societal benefit.)
Our high resolution, global Digital Elevation Model (DEM) data set is unique. It is the only topographic data freely available to all users covering the land surface of the Earth at 30m resolution. We have a vigorous monitoring program of 1500+ active volcanoes, and 100,000+ glaciers, looking for time-dependent change. We also acquire many images for post-disaster mitigation, like damage from tsunamis.
5. Do you have favorite image(s) of ASTER?
See the interview with National Geographic: http://news.nationalgeographic.com/2016/04/160406-pictures-nasa-terra-aster-satellites-space-science/

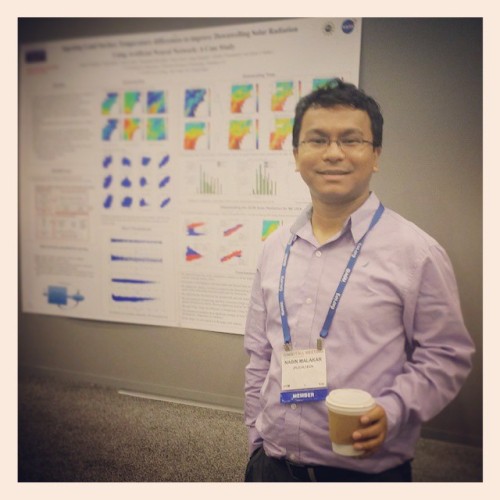
A selfie with Dr. Abrams.
Note: I had an opportunity to be a co-author with him on the paper:
The ASTER Global Emissivity Dataset (ASTER GED): Mapping Earth's emissivity at 100 meter spatial scale, GC Hulley, SJ Hook, E Abbott, N Malakar, T Islam, M Abrams
Geophysical Research Letters 42 (DOI: 10.1002/2015GL065564)
http://onlinelibrary.wiley.com/doi/10.1002/2015GL065564/full 

Thursday, February 11, 2016

Gravitational Waves and LIGO Experiment

One of the fascinating argument of Einsteins' theory of General Relativity can be simply illustrated by the foam-ball diagram. Where a heavy ball put on the surface would produce a curvature. Thereby generating the deformation so that if a lighter ball is rolling nearby, it would cause the ball to roll towards the bigger ball.

Similarly, if we imagine that the space-time that our universe resides is a giant surface in 4-dimension, then we can argue that things that have mass will cause that surface to bend. In other words, the matter will tell the spacetime where to bend while the spacetime curvature will then dictate how the mass will travel.  The more "heavy" the mass, the more bending. Ultimately, the  heavy "mass" or huge Energy, can cause a hole in the fabric of spacetime. That we call the black hole!

What is interesting is that we can imagine traveling from point A to B. If the amount of effort that is required is called as action, then naturally one tends to minimize the action. The most straightforward way to minimize the action in two dimension is a straight line! Now, if you were in four dimension, and wanted to go from point (need to call it a four-point as it has four co-ordinates) A to point B. Then naturally, it would be a "straight" line in 4D! However, the manifestation of the space and time makes it look like a curved line near the "heavy" masses. That's the reason behind the orbits of the planets. You may ask: but, aren't the planets coming back to the same positions after one planetary year? Yes, that is right in space. But in time, you moved one year's worth of journey! Think about it!
That means there is no force which is pulling things around. It is just the manifestation of the bending of the spacetime fabric.

When  masses accelerate, gravitational waves are produced. This can cause "ripples" in the space!
The LIGO experiment, (LIGO: The Laster Interferometer Gravitational-Wave Observatory) was designed in 1992. It is a large-scale physics experiment to detect gravitational waves. It consists of 4 km long tunnels in L-shape. LASER interferometry is used to detect any change in the fabric of space due to the gravitational wave. Interferometry go about finding changes in the distance between the points A and B by using the principle of superposition of the waves, by measuring the change in the fringes due to shifting of the reflecting mirrors for example.  This works because when two waves with the same wavelength/frequency meet, their fates are determined by the phase difference between the waves. The waves in phase will undergo constructive interference and the out-of-phase will undergo destructive interference [See this video: https://www.youtube.com/watch?v=J_xd9hUZ2AY More specifically this one : https://www.youtube.com/watch?v=oUytkiBwXvI]. 

In the case of LIGO experiment, the primary interferometers consist of mirrors suspended at each corners of the L-shaped vacuum tube (4km long). A LASER beam is used to monitor the interference patterns called fringes. When a gravitational wave passes through the interferometer site, the fabric of spacetime is affected. Since the instrument is L-shaped, one side will be stretched while the other side is compressed. This changes the phase of the reflecting waves causing the phase difference between the ends of the L-tube, and thus the wave should be detected!!! 
The LIGO has to detect the distortion of 10^(-18) m in space for the light that reflects off the 4-km long tunnel! This is the length less than one thousandth of the diameter of a proton (fm=10^-15). Moreover, since there are two LIGO experiment sites(46°27′18.52″N119°24′27.56″W and
30°33′46.42″N90°46′27.27″W), triangulation method can be used to find the source of the ripple!
Here is a nice video explaining the method


Now here comes the big news!

LIGO has detected the gravitational wave!!!
The authors claim that the signals came from two merging black holes, each about 30 times the mass of our sun, lying 1.3 billion light-years away.
The scientific paper is here:

If you are interested in the press release,
https://mediaassets.caltech.edu/gwave#graphics

FYI: India is working on next LIGO experiment
https://www.ligo.caltech.edu/page/ligo-india

Also, it seems like Einstein had doubt about the Gravitational waves at some point
http://scitation.aip.org/content/aip/magazine/physicstoday/article/58/9/10.1063/1.2117822

One interesting presentation
https://www.youtube.com/watch?v=ajZojAwfEbs


Disclaimer: These are my personal notes. Please draw conclusions at your own risk.


Tuesday, January 20, 2015

Crowdfunding Science: Experience from a Developing Country

In 2014, we raised $3772.10 + NRs 61797 from a fundraising campaign in my coordination. Majority of this amount was collected via a crowdfunding platform, the Fundrazr.com and was used to buy UV-Vis spectrophotometer (a scientific instrument) and accessories for Department of Chemistry, Mahendra Morang Adarsha Multiple Campus (MMAMC), Biratnagar, Nepal.
Educational institutions in Nepal like other developing countries lack basic infrastructure (instruments, equipment) for teaching and research in science, as unfortunately, support from the government is not enough. However, despite the lack of basic facilities, few enthusiastic researchers are trying their best to carry out research and train their students in science.
Among various other campuses around the country, MMAMC, Biratnagar desperately needed an UV-Vis spectrophotometer, one of the basic instruments in many disciplines of science including chemistry. Unfortunately, neither MMAMC nor the Tribhuvan University could support the purchase of this instrument, making external funding crucial. Unlike others, Dr. Ajaya Bhattarai, assistant professor of chemistry from MMAMC came forward and discussed the possibilities of obtaining funds with me.
Crowdfunding
We then decided to ask our friends around the globe to donate. Rather than asking privately, we decided to use a public forum in order to let more people know about our campaign for a good cause.
In recent years, crowdfunding has become very popular to generate funds for variety of purposes including support for scientific research. The crowdfunding is an idea of raising fund for a common cause from a large number of people primarily via internet. Even though crowdfunding had initially found successful in developed countries like US, Europe, and Australia, the rapid rise of mobile technology and social media utilization has made crowdfunding more viable opportunity to finance innovation in developing countries.
Ready to face harsh comments and questions

When you ask for money, there are people who think the donation is important and are happy with it; however, you also face some people who have an aversion to the idea. We also obtained similar responses. Most of the comments we received during the fundraising period were very encouraging. But there were some negative ones. Some people tried to connect my relationship to Biratnagar and if it was for my personal benefit. One person, I know personally, argued really hard with me and said he would donate if it were for his village or school. There were some social media arguments started at the same time referring to the idea of “giving” to developing country is really bad.
Important factors for successful crowdfunding
Not all projects seeking crowdfunding are successful. More than half of such projects fail to reach their goal.  I have following suggestions for successful fundraising campaign.
  1. A clear idea: Our fundraising campaign had a clear goal of buying scientific instrument for MMAMC and a good explanation of why the fund was needed.
  2. Networking: We networked to our prospective donors primarily through Facebook. We have a group of Nepali chemists on Facebook; that helped a lot. We reached out to all of them in addition to contacting people from Biratnagar and those who studied in MMAMC residing in developed countries. We also sent personal email to many donors.
  3. Know your target donors: People who are either affiliated to the MMAMC or had studied chemistry residing abroad were our target donors. However, we raised a considerable amount of money from people residing in Nepal offline. As online payment system is not widely used in developing countries, it was difficult to raise funds inside country via online platform.
  4. Authenticity: It is important to understand the fact that potential donors are very cautious about the authenticity of the fundraising and the proper use of money after collection. Our donors were familiar to the fact that the instruments donated to Tribhuvan University and other governmental research centers mostly sit idle dust covered. Therefore, in our case, we had to convince our donors that the instrument would definitely be used regularly. Dr. Ajaya Bhattarai and his background played crucial role in this case.
A successful example.
Potential funders want to see the people behind the fundraising event. We asked ourselves: do people really believe on what we are asking for? We tried our best to be as transparent as possible telling who are behind the fund raise, how the money will be utilized and who will be responsible for purchase, use, and care of instrument. We requested our friends to share the event using social media.
Before this fundraise event, my friends (mostly chemists) and I had also raised fund to buy a projector and laptop for Central Department of Chemistry, Tribhuvan University. This previous experience increased our confidence and people’s belief on us.
  1. Share and publish the details: We kept updating the progress of fundraising on regular basis. We wrote our aim and objectives clearly on the crowdfunding website.
Did we get all money raised?
The answer is a big NO. In our case, the crowdfunding company deducted 8.7% of the total money raised via crowdfunding platform (online) including the PayPal fee. Plus a fee to transfer money from US to Nepal.

Finally, I am happy to share with you that the instrument we donated is being regularly used and has generated some data. Dr. Ajaya Bhattarai recently presented the findings of his research on the interaction of dyes with surfactants using UV-Vis spectrophotometer in the 16th international symposium on eco-materials processing and design (ISEPD 2015) in Kathmandu, Nepal. This is important to mention here because many people think [which unfortunately could be true in some cases] that donated equipment are not being used rather they are stored with dust covered. Well, we assure to let the work speak for itself. Thank you!


--
>

Tuesday, December 30, 2014

#AMS2015, January 04 - 08, 2015 Phoenix, AZ #conference @ametsoc

Data fusion of Satellite AOD and WRF meteorology for improved PM25 estimation for northeast USA

Monday, 5 January 2015: 1:45 PM 
at Sixth Conference on Environment and Health)
228AB (Phoenix Convention Center - West and North Buildings)
Nabin Malakar, City College of New York, New York, NY; and L. Cordero, B. Gross, D. Vidal, and F. Moshary
The current approach to ingesting satellite data (IDEA- Infusing satellite Data into Environmental air quality Applications Product) into surface PM2.5 retrievals uses a combination of spatial interpolation and a global geo-chemical model (GEOS-CHEM) to define appropriate mass to AOD factor maps that can be used with satellite AOD retreivals. This information is then statistically blended with current AIRNow measurements creating a refined retrieval product. In this paper, we propose to use the same approach except that we replace the GEOS-CHEM component with an alternative high resolution meteorological model scheme. In particular, we illustrate that the GEOS-CHEM factors can be strongly biased and explore methods that incorporate a combination of satellite AOD retrievals with WRF meteorological forecasts on a regional scale. We find that although PBL height should be a significant factor, the WRF model uncertainties for PBL height in comparison to Calipso make this factor less reliable. More directly we find that the covarying PBL averaged temperature (together with wind direction) are the most important factors. Direct statistical comparisons are made against the IDEA product showing the utility of this approach over regional scales. In addition, we explore the importance of a number of factors including season and time averaging showing that the satellite approach improves significantly as the time averaging window decreases illustrating the potential impact that GOES-R will have on PM25 estimation.
.

Fusing Spatial Kriging with Satellite Estimates to Obtain a Regional Estimation of PM2.5

Daniel Vidal, City College of New York, New York, NY; and B. Gross, N. Malakar, and L. Cordero
This work focuses on developing estimates of ground-level fine particulate matter (PM2.5) in the northeastern U.S. based on measurements derived from the Air Quality System (AQS) repository. Real time monitoring of PM2.5 is important due to its effect on climate change and human health, however, designated samplers used by state agencies do not provide optimal spatial coverage given their high cost and extensive human labor dependence. Through the application of remote sensing instruments, information about PM2.5 concentrations can be generated at certain locations. On the other hand, coverage limitation also occurs when using satellite remote sensing methods due to atmospheric conditions. Therefore, our approach begins by utilizing surface PM2.5 measurements collected from the Remote Sensing Information Gateway (RSIG) portal in order to build fine particulate matter estimations by applying a Spatial Kriging technique. Then, we combine our Kriging estimations to the satellite derived PM2.5 obtained through an Artificial Neural Network (ANN) scheme to generate a daily regional PM2.5 product. Finally, evaluation of our fused algorithm's technique is assessed by performing comparisons against Kriging and neural network individual performances, showing the promising value added by the combination of these two techniques in producing more accurate estimations of surface level PM2.5 over our region of interest.

This one is related to the award winning work by Daniel:


Analysis of New York City traffic data, land use, emissions and high resolution local meteorology for the prediction of neighborhood scale intra-urban PM2.5 and O3
Monday, 5 January 2015: 4:30 PM 

at Sixth Conference on Environment and Health)
228AB (Phoenix Convention Center - West and North Buildings)
Chowdhary Nazmi, NOAA/CREST/City College, New York, NY; and N. Malakar, L. Cordero, and B. Gross
Air pollution affects the health and well-being of residents of mega cities like New York. Predicting the air pollutant concentration throughout the city can be difficult because the sources and levels of the pollutants can vary from season to season. Local meteorology, traffic and land use also play an important role in these variations and the use of statistical machine learning tools such as Neural Networks can be very useful. In order to develop a Neural Network for the prediction of intra-urban air pollutants (PM2.5, O3), high resolution local data are collected and analyzed. Surface level high resolution temperature, relative humidity and wind speed data are collected from the CCNY METNET network. Annual average daily traffic data from NYMTC model as well as continuous and short count traffic data are collected from NYSDOT. High density data from NYC Community Air Survey model is used to analyze the relationship between background and street level indicators for PM2.5 and O3. All the variables (meteorology, population, traffic, land use etc) are ranked according to the absolute strength of their correlation with the measured pollutants and highest ranking variables are identified to be used for the development of a Neural Network. An analysis of how street level pollution differs from background AIRNow observations will be made showing the importance of high density observations. The potential to use the model in other urban areas will also be explored.

Having now relocated to NASA JPL, it is fun to reflect back to see what was accomplished during my stay at CCNY.


Friday, December 19, 2014

Presented in the AGU 2014, San Francisco, CA

  • GC51D-0460Ingesting Land Surface Temperature differences to improve Downwelling Solar Radiation using Artificial Neural Network: A Case Study
  • In order to study the effects of global climate change on regional scales, we need high resolution models that can be injected into local ecosystem models. Although the injection of regional Meteorological Models such as Weather Research and Forecasting (WRF) can be attempted where the Global Circulation Model (GCM) conditions and the forecasted land surface properties are encoded into future time slices - this approach is extremely computer intensive.
    We present a two-step mechanism in which low resolution meteorological data including both surface and column integrated parameters are combined with high resolution land surface classification parameters to improve on purely interpolative approaches by using machine learning techniques. In particular, we explore the improvement of surface radiation estimates critical for ecosystem modeling by combining both model and satellite based surface radiation together with land surface temperature differences.
    Authors

    Nabin Malakar - NASA Jet Propulsion Laboratory
    Mark Bailey
    CUNY City College
    Rebecca Latto
    CUNY City College
    Emmanuel Ekwedike
    CUNY City College
    Barry Gross
    CUNY City College
    Jorge Gonzalez
    CUNY City College
    Charles Vorosmarty
    CUNY City College
    Glynn Hulley - NASA Jet Propulsion Laboratory


    A51B-3024Bias Correction of MODIS AOD using DragonNET to obtain improved estimation of PM2.5

MODIS AOD retreivals using the Dark Target algorithm is strongly affected by the underlying surface reflection properties. In particular, the operational algorithms make use of surface parameterizations trained on global datasets and therefore do not account properly for urban surface differences. This parameterization continues to show an underestimation of the surface reflection which results in a general over-biasing in AOD retrievals. Recent results using the Dragon-Network datasets as well as high resolution retrievals in the NYC area illustrate that this is even more significant at the newest C006 3 km retrievals. In the past, we used AERONET observation in the City College to obtain bias-corrected AOD, but the homogeneity assumptions using only one site for the region is clearly an issue. On the other hand, DragonNET observations provide ample opportunities to obtain better tuning the surface corrections while also providing better statistical validation. In this study we present a neural network method to obtain bias correction of the MODIS AOD using multiple factors including surface reflectivity at 2130nm, sun-view geometrical factors and land-class information. These corrected AOD’s are then used together with additional WRF meteorological factors to improve estimates of PM2.5. Efforts to explore the portability to other urban areas will be discussed. In addition, annual surface ratio maps will be developed illustrating that among the land classes, the urban pixels constitute the largest deviations from the operational model.